The moving average convergence divergence (MACD) is a popular technical indicator used by traders to analyze the strength and direction of a security's price action.
Here are five ways in which the MACD can be used in trading:
Trend identification:
Traders often use the MACD to identify potential trend changes in a security's price. If the MACD is consistently trading in a narrow range, it may indicate that the security is range-bound, meaning it is fluctuating within a specific price range without a clear trend. When the MACD breaks out of this range, it could signal a potential breakout in the price of the security. For example, if the MACD has been consistently trading in a narrow range but then suddenly breaks above or below this range, it could indicate that the security's price is about to make a significant move.
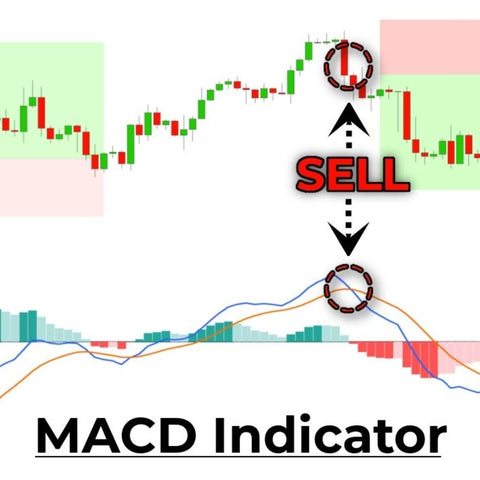
Divergences:
Traders can also use the MACD to identify divergences, which occur when the price of a security moves in the opposite direction of the MACD. A bullish divergence occurs when the price makes a new low, but the MACD makes a higher low, indicating that the underlying strength of the security is improving. A bearish divergence occurs when the price makes a new high, but the MACD makes a lower high, suggesting that the security is losing strength.
Trend confirmation:
Another way that traders can use the MACD to analyze price movements is by looking at the position of the MACD line relative to the zero line. If the MACD is above the zero line, it indicates that the 12-day EMA is trading above the 26-day EMA, which could be a sign of an uptrend. On the other hand, if the MACD is below the zero line, it indicates that the 12-day EMA is trading below the 26-day EMA, which could be a sign of a downtrend.
The direction of the MACD line can also be used to confirm the direction of a trend. If the MACD is above the zero line and rising, it indicates an uptrend. If the MACD is below the zero line and falling, it indicates a downtrend. However, it is important to note that the MACD is just one tool that traders can use to analyze price movements. It is often used in conjunction with other technical indicators and fundamental analysis to make more informed trading decisions.
Breakouts:
Traders can also use the MACD to analyze price movements is by looking for potential breakout points. A breakout is a sudden and significant move in the price of a security, either up or down, that breaks through a key level of resistance or support. Breakouts can indicate a change in the underlying trend of a security and can be an opportunity for traders to enter or exit a position.
If the MACD is consistently trading in a narrow range, it may indicate that the security is range-bound, meaning it is fluctuating within a specific price range without a clear trend. When the MACD breaks out of this range, it could signal a potential breakout in the price of the security. For example, if the MACD has been consistently trading in a narrow range but then suddenly breaks above or below this range, it could indicate that the security's price is about to make a significant move.
It is important to note that the MACD is just one tool that traders can use to analyze price movements. It is often used in conjunction with other technical indicators and fundamental analysis to make more informed trading decisions.
Overbought and oversold levels:
The MACD has an overbought level of 0.80 and an oversold level of -0.80. When the MACD is above 0.80 (for example), it indicates that the security may be overbought and therefore prone to a price decline. Conversely, when the MACD is below -0.80, it suggests that the security may be oversold and ready for a price rally.


Leave a comment